Projects
“Hiding within those mounds of data is the knowledge that could
change the life of a patient, or change the world.” – By Atul Butte
Flagging Nuclear Dual Use Goods
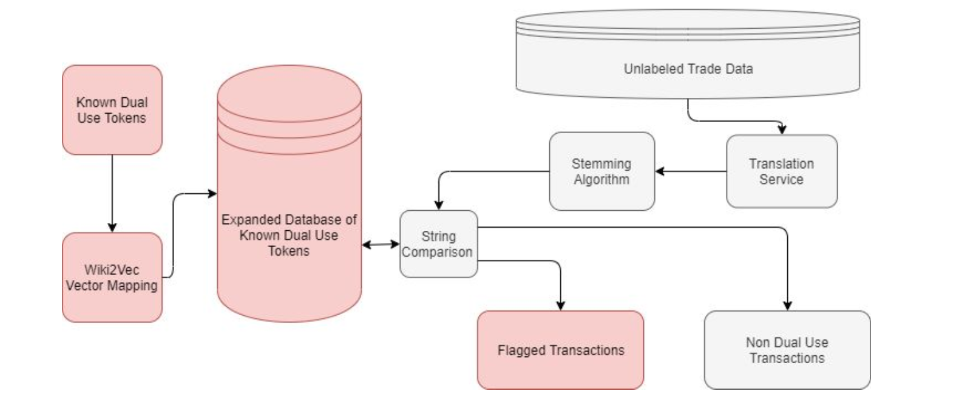
Given 65 million rows of trade data, in a non-English language, the task was to create a pipeline that could flag an individual trade as containing materials that could be used in the nuclear fuel production cycle, and return a dataset of flagged data. Like finding a needle in a haystack my team tried a variety of methods to reach our goal. Before reaching our end product I lead research into methods of working with positive/unlabeled data. Myself and my team implemented many variations of ML methods using the ROC AUC score as a metric. I was solely responsible for all clustering experimentation, contributed to the massive cleaning process and implementated our pipeline in an Amazon EC2 instance which pulled from Amazon S3 Buckets. Read an in depth analysis of our project here.
Using FEMA data to Track and Predict Flooding
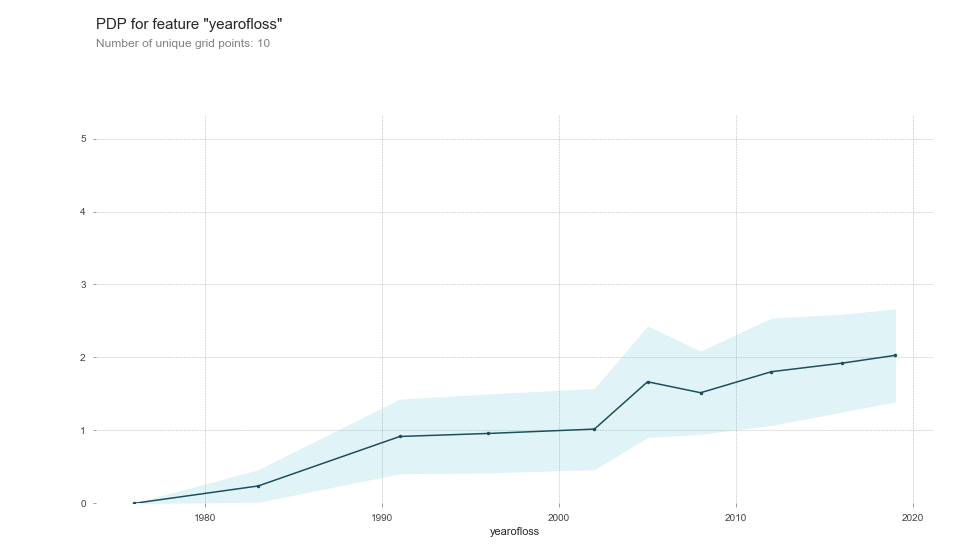
Inspired by reports that global warming causes increased flooding, in this solo project I sought to find that trend in the FEMA Claims data and use that to predict future flood heights. After sampling from a 2.4 million row dataset and dropping unnecessary columns I used applied Ridge Regression, Random Forest Regression, and XGBoost to a dataset of ~36,000 rows. I expanded my learning as I ran into complications such as FEMA not collecting data on flood heights, leakage, and specific natural disasters causing an overwhelming amount of claims. Follow me through my process in this article I wrote, and check out my code on Github.
Medical Marijuana Strain Suggestor
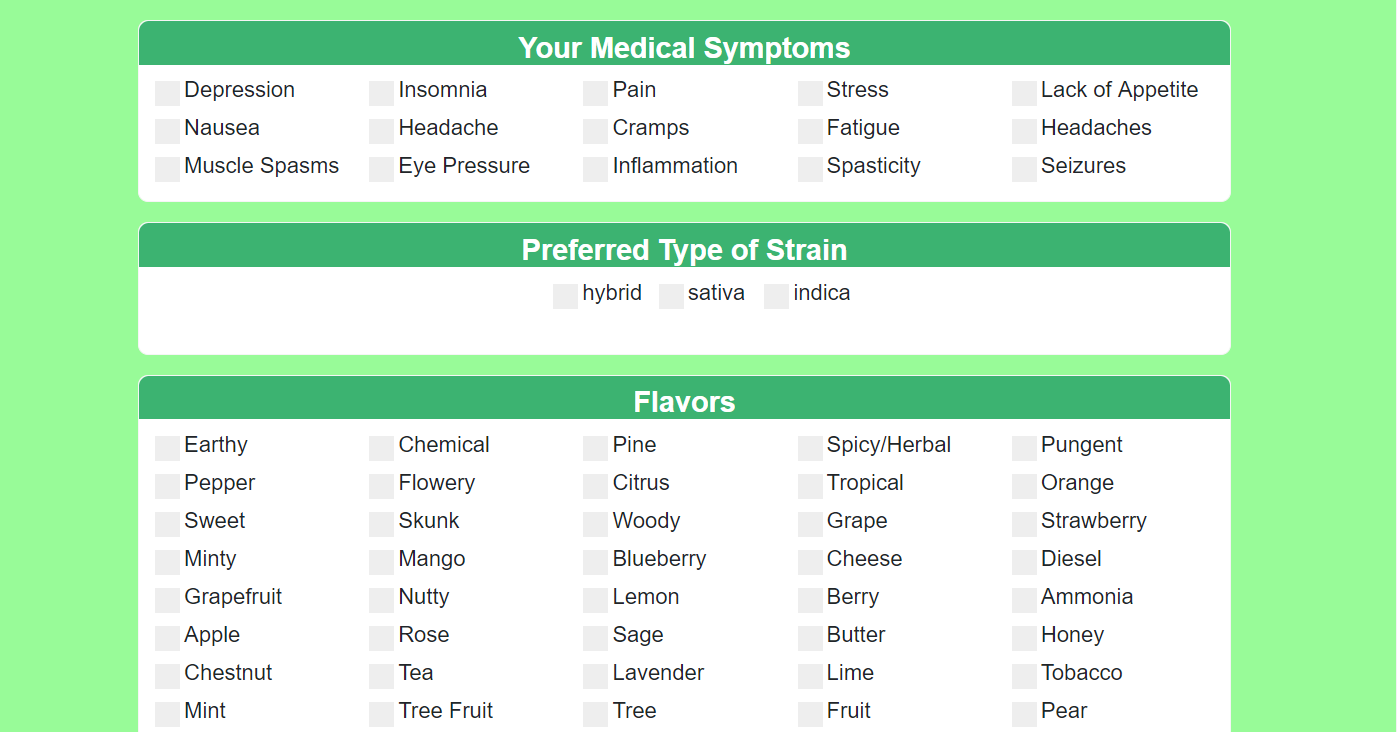
In one week myself and a cross-functional team built an app designed to assist medical marijuana users. My role was to build the recommendation system with another data science student. The user provided a variety of variables they are looking for including ailments they want relief from, preferred flavors and other desired feelings. We used TF-IDF to vectorize the medical effects all the strains in our database. Then, using the user's medical ailments we created ten suggested strains using the TF-IDF matrix and k-Nearest Neighbors. This prioritized medical benefits above all other input, before filtering out some of those ten strains to meet (if possible) the user's desired flavors and effects. The final product contains this recommendation system, as well as a user profile, login, saved strains, and a search bar allowing you to query our entire 3000+ strain database. These features were created by the web component of our team in just five days. You can find my code creating the recommendation system here, as well as the launched product named Dr. Mary Jane.
Analysis of Musicians and Instagram
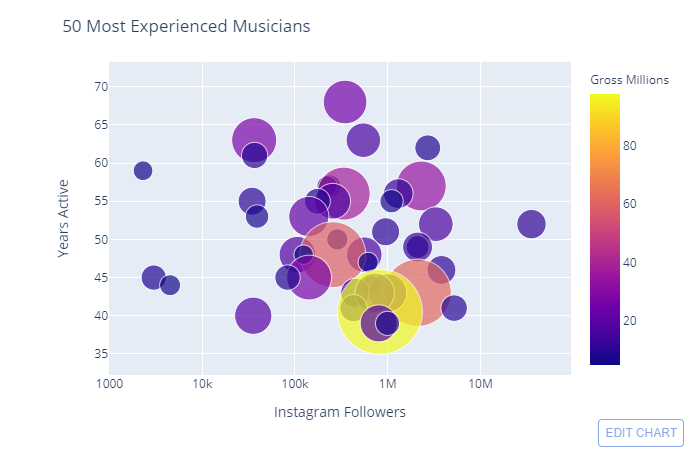
After spending time performing original music I was very curious to see if data backed up the assumption that increasing your Instagram followers leads to an increase in profit. Using the 2018 Top 200 North American Tours data, I found that while the outlying highest earners have a massive amount of followers, musicians without just a few thousand followers were able to charge the highest ticket prices. Seeing that these musicians tended to be older, I went on to explore how the oldest musicians compared with those musicians with the most followers. This was an exercise in data wrangling, cleaning, merging and visualization. You can find my article about it here as well as my code.
Scraping and Wrangling Data

This project was very exciting for me, I learned so much along the way. I have been working with two web developers on creating an app that helps users find nearby medical marijuana dispensaries and recommends strains based on medical ailments. My task at this stage of the project has been collecting and cleaning data. There is a Kaggle dataset which lists a couple thousand strains along with a description, user rating, the medical effects they treat, and other effects they have. However, we wanted to add much more data, including more stains, information about the lineage, updated user feelings, user reviews, and their terpene profile. To create this, I worked on webscraping Leafly, a popular medical marijuana information website. For this project, I taught myself how to webscrape using BeautifulSoup and Selenium. I ended up being very successful, capturing all the information we wanted as well as some extra info. You can find this work in the leafly_scraper notebook. I began by collecting all of the strain names on their website, then visited each one individually. I used Selenium to click on each strain, click through pop-ups and age gates, and to click to load all reviews. From there I was able to create a dataset of all the feelings the users reported, THC content, the star rating, any images available, parents and children of the strain, and the level of various terpenes in the strain. Check out my code.
k-Nearest Neighbors Algorithm
As a quick project to explore the algorithms behind common data science methods, I decided to recreate the k-Nearest Neighbors algorithm from scratch. This is a very common clustering algorithm that falls into the category of unsupervised machine learning. Written so that any audience can understand some of the magic behind data science, my article explains in layman's terms the math behind k-Nearest Neighbors.